Overall Trading Record of Closed Positions Including Today's Trades (Since March 3, 2011)
Cumulative W/L = 172 - 46 (plus 220 - 53 from 2009 trading sample)
Cumulative Non-Compounded Gain = 154.69% (plus 139.22%+ from 2009 trading sample)
Today's Trades
Cum Compound
Symbol Buy Pr Sell Pr Short Pr Cover Pr Tot Gain W L Cum W Cum L Gain Gain
MGM 14.92 14.63 1.94% 1 173 46 156.63% 366.59%
MGM 14.91 14.63 1.88% 1 174 46 158.51% 375.35%
MGM 15.01 14.63 2.53% 1 175 46 161.04% 387.39%
F 15.33 15.15 1.17% 1 176 46 162.22% 393.11%
BAC 12.39 12.28 0.89% 1 177 46 163.10% 397.49%
MGM 15.00 14.63 2.47% 1 178 46 165.57% 409.76%
MGM 15.05 14.63 2.79% 1 179 46 168.36% 423.98%
MGM 15.10 14.63 3.11% 1 180 46 171.47% 440.29%
MGM 15.09 14.63 3.05% 1 181 46 174.52% 456.76%
BAC 12.37 12.28 0.73% 1 182 46 175.25% 460.82%
BAC 12.41 12.28 1.05% 1 183 46 176.30% 466.69%
F 15.26 15.15 0.72% 1 184 46 177.02% 470.78%
MGM 14.65* 14.63 0.14% 1 185 46 177.15% 471.55%
MGM 14.66* 14.63 0.20% 1 186 46 177.36% 472.72%
MGM 14.68* 14.63 0.34% 1 187 46 177.70% 474.67%
MGM 14.70* 14.63 0.48% 1 188 46 178.18% 477.41%
MGM 14.84** 14.63 1.42% 1 189 46 179.59% 485.58%
MGM 14.82** 14.63 1.28% 1 190 46 180.87% 493.09%
MGM 14.84** 14.63 1.42% 1 191 46 182.29% 501.48%
MGM 14.77** 14.63 0.95% 1 192 46 183.24% 507.18%
BAC 12.38 12.28 0.81% 1 193 46 184.04% 512.09%
* Trade was made March 9, 2011
** Trade was made March 10, 2011
All Currently Open Positions
YRCW 2.44*
YRCW 2.37*
YRCW 2.32**
YRCW 1.69***
YRCW 1.25****
YRCW 1.76*****
YRCW 1.73******
YRCW 1.65*******
YRCW 1.71********
YRCW 1.35*********
YRCW 1.40*********
YRCW 1.43*********
YRCW 1.45*********
YRCW 1.43*********
YRCW 1.30**********
YRCW 1.26**********
YRCW 1.23**********
*Trade was made March 7
**Trade was made March 9YRCW 1.65*******
YRCW 1.71********
YRCW 1.35*********
YRCW 1.40*********
YRCW 1.43*********
YRCW 1.45*********
YRCW 1.43*********
YRCW 1.30**********
YRCW 1.26**********
YRCW 1.23**********
*Trade was made March 7
***Trade was made March 16
****Trade was made March 17
*****Trade was made March 30
******Trade was made March 31
*******Trade was made April 11
********Trade was made April 13
*********Trade was made May 2
**********Trade was made May 3
Overall Trading Record of Closed Positions Including Today's Trades (Since March 3, 2011)
Cumulative W/L = 193 - 46 (plus 220 - 53 from 2009 trading sample)
Cumulative Non-Compounded Gain = 184.04% (plus 139.22%+ from 2009 trading sample)
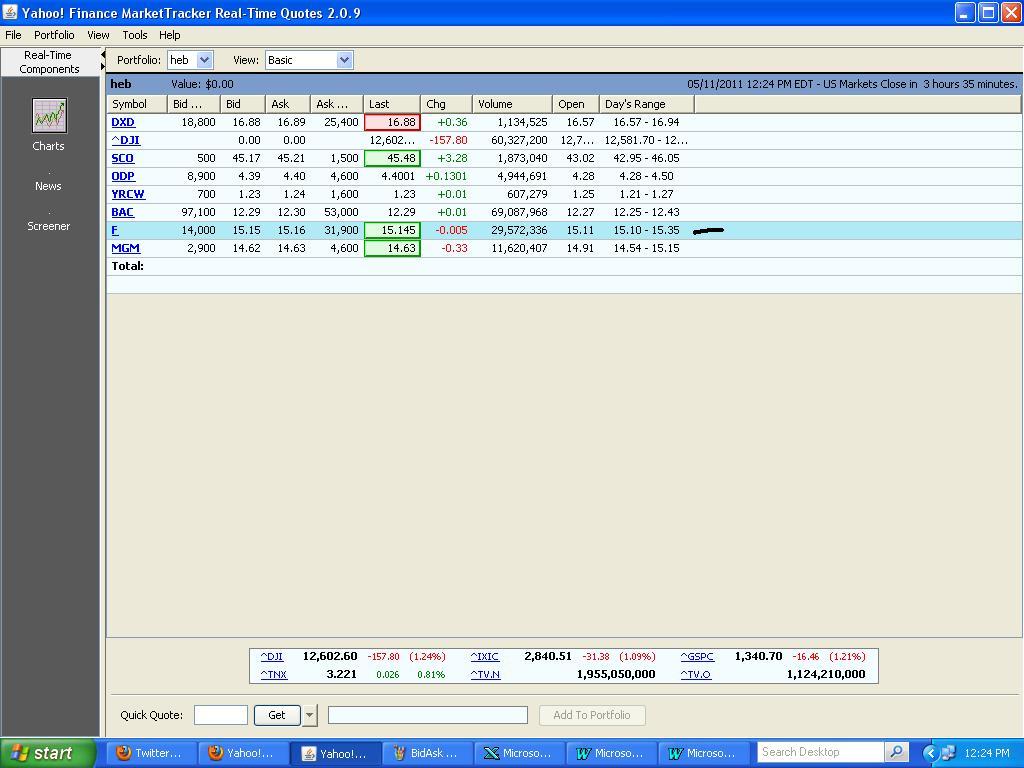
Images To Verify Price Of Trades
Note: When the stock market is busier than usual (such as 9:30 - 10:00 AM & 3:30 - 4:00pm), the bid/ask showing on my real-time quotes is actually delayed by a few minutes. (This is explained in my first few trading posts around the date of March 3, 2011). If you would like further verification of this, simply contact me and I can create a new image for you that verifies the slight bid/ask time delay!
However, the "last" price showing on my real-time quotes is always current. Therefore, regardless of any bid/ask time delay, the "last" price imaged below should always match and verify the price that I predicted on Twitter and in the table above.
When the last price is showing to only two decimal places (for example, 1.90), that cannot prove whether the bid is 1.90 or whether the ask is 1.90. In order to provide proof, I attempt to take images when the “last” price is showing to three or more decimals places. That way, the bid and ask can be pretty reliably determined: for example, if the “last” price is showing as 1.907, it’s very likely the bid is 1.90 and the ask is 1.91.
Note: The following Twitter images/predictions can also be verified by visiting my Tweet history on my Twitter profile:


No comments:
Post a Comment